admin
admin
Bitcoin finally made it above $64,000, even though the bears quickly dragged it below the range. The ongoing consolidation is looked to be a part of a post-halving accumulation that breaks out 170 days after the event. The rally further peaks after 480 days and hence it appears that the rally is yet to begin as we are currently 152 days after the BTC halving. As the US elections are underway, global liquidity is expected to spike up. Therefore, the BTC price is believed to break out violently from the pattern it is trading at the moment.
On the other hand, the BTC price has not confirmed a rise above the bearish influence, which has kept the possibility of a rejection alive. Ever since the BTC price surpassed $64,000, the bears have become pretty vigilant and are exerting enough pressure over the token. Currently, the price has dropped below $63,000 after losing the higher range soon after marking daily highs. With this, the bearish hopes of plunging back below $60,000 arise, but here’s the major twist.
As per the data from Coinglass, the BTC Puell multiple indicators have just flashed bullish signals as the indicator is approaching the green zone. The indicator reaching the red zone suggests the BTC price is too high and hence needs to drop. Conversely, the indicator in the green zone indicates that the price is pretty low and could bounce very soon. It is a miner revenue-based indicator and hence reaching the red zone also indicates their revenues are higher than 365-D MA levels. This may compel some of the miners to close the rigs, which may decrease the hash rate.
At present, the levels are about to enter the green zone, which is a bullish signal and also be considered a great time to accumulate BTC. Regardless of this, the price has not confirmed a bullish reversal and in such a case, the question arises: whether the token will form another lower high?
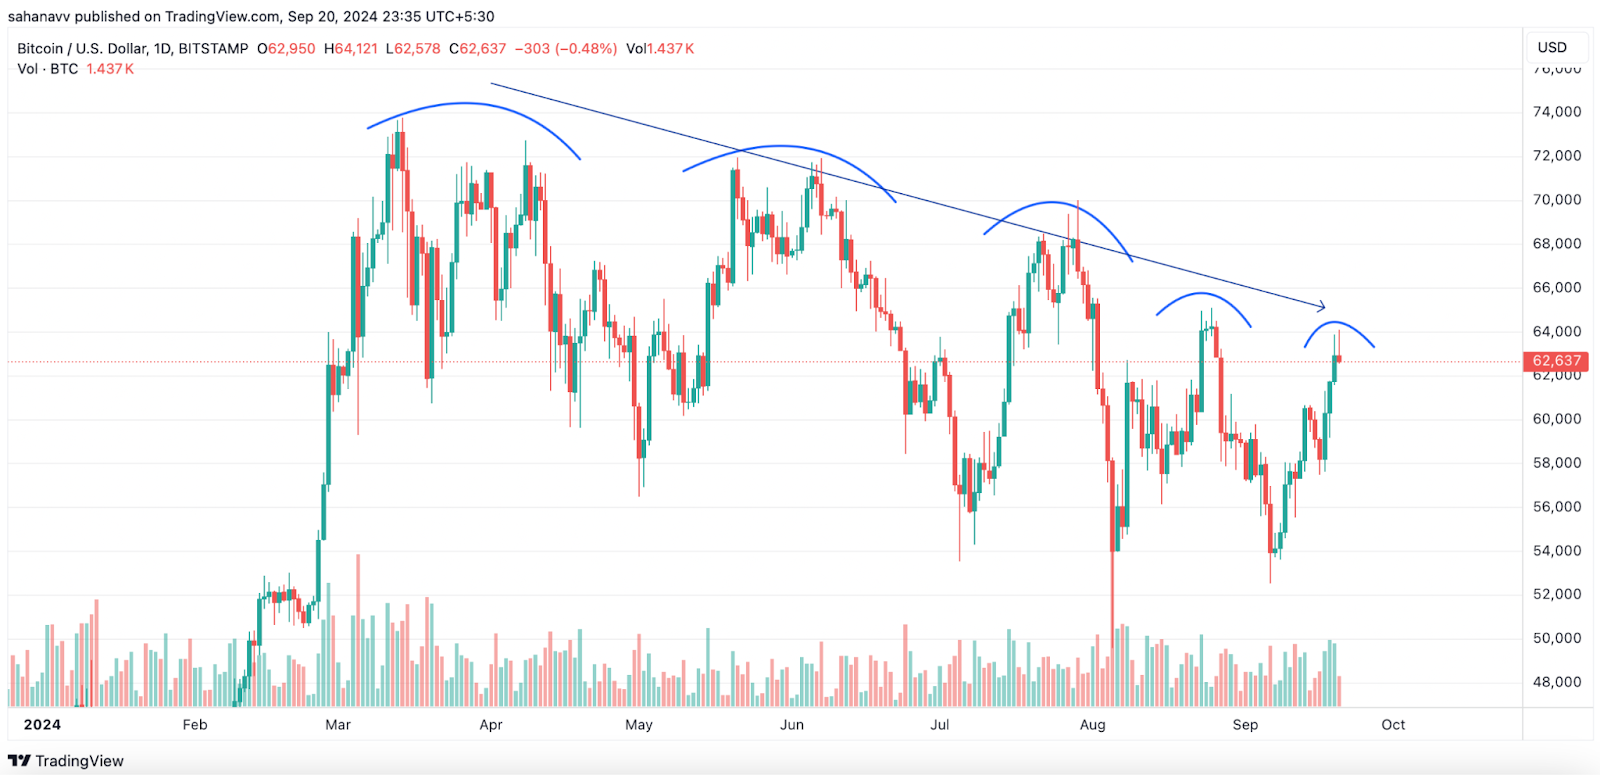
The daily chart of Bitcoin offers a clear picture of it remaining stuck within a descending trend. The latest move may have raised the price above the local resistance, but the bulls are falling week as they approach the descending trend line, acting as a pivotal resistance. With the daily candle turning bearish, the possibility of the token forming another lower high has emerged.
Regardless of the interim bearish influence, the Bitcoin (BTC) price, from a wider perspective, continues to trade under the bullish influence within a bull flag. Hence, a breakout from the pattern is expected to trigger a massive run, probably beyond $100K.